
The Architecture of Rivalry: How Activity System Interdependence Shapes Competitive Convergence and Divergence
Published in 4th Competitive Dynamics Conference (CD-4), 2026
Abstract
How does the internal architecture of a firm’s activity system shape the competitive consequences of imitation? NK landscape models formalize how interdependent activities create rugged fitness landscapes, yet they model firms as isolated searchers — ignoring rivalry, imitation pressure, and the emergent crowding that arises when multiple actors converge on the same activities. Conversely, competitive dynamics research explains when and why firms imitate rivals but treats the imitator’s internal configuration as a black box. This paper integrates both literatures through the {K} Interdependence System — a 2×2 framework that identifies four coupled degrees of interdependence in any strategic search system: KAC (scope), KCC (epistasis), KCA (popularity), and KAA (sociality). Traditional NK models address {KAC, KCC}; competitive dynamics research is centrally concerned with {KCA, KAA}. Each literature has been studying half of the system. We complete the circuit.
Three propositions emerge from the integrated framework. First, the same imitation mechanism produces strong convergence under hierarchical activity systems but zero net convergence under modular systems — architecture moderates the structure-conduct relationship. Second, rivalry-driven portfolio diversification provides “shock insurance” against environmental perturbations, while imitation-driven correlation produces systemic fragility. Third, an “imitation mirage” arises when observed imitation advantage diverges from counterfactual imitation benefit — a discrepancy that is architecturally determined. We test these propositions using a logit-NK/SAOM simulation engine with 60-firm, 32-activity configurations across hierarchical, modular, and random architectures, and anchor the framework empirically in the U.S. airline industry (1993–2025).
Key Contributions
- Introduces the {K} Interdependence System — a meta-theoretical framework that reveals NK landscape theory and competitive dynamics as complementary halves of a single bipartite Actor × Component system
- Demonstrates that activity system architecture (hierarchical vs. modular) moderates competitive convergence, resolving seemingly contradictory predictions from imitation theory and the resource-based view
- Develops the concept of the imitation mirage — the gap between observed and counterfactual imitation effects — showing it is architecturally determined, not random
- Introduces a novel logit-NK/SAOM simulation methodology that embeds competitive interdependence within landscape search
Figure 1. The Convergence Puzzle: Thirty-Three Years of Competitive Overlap
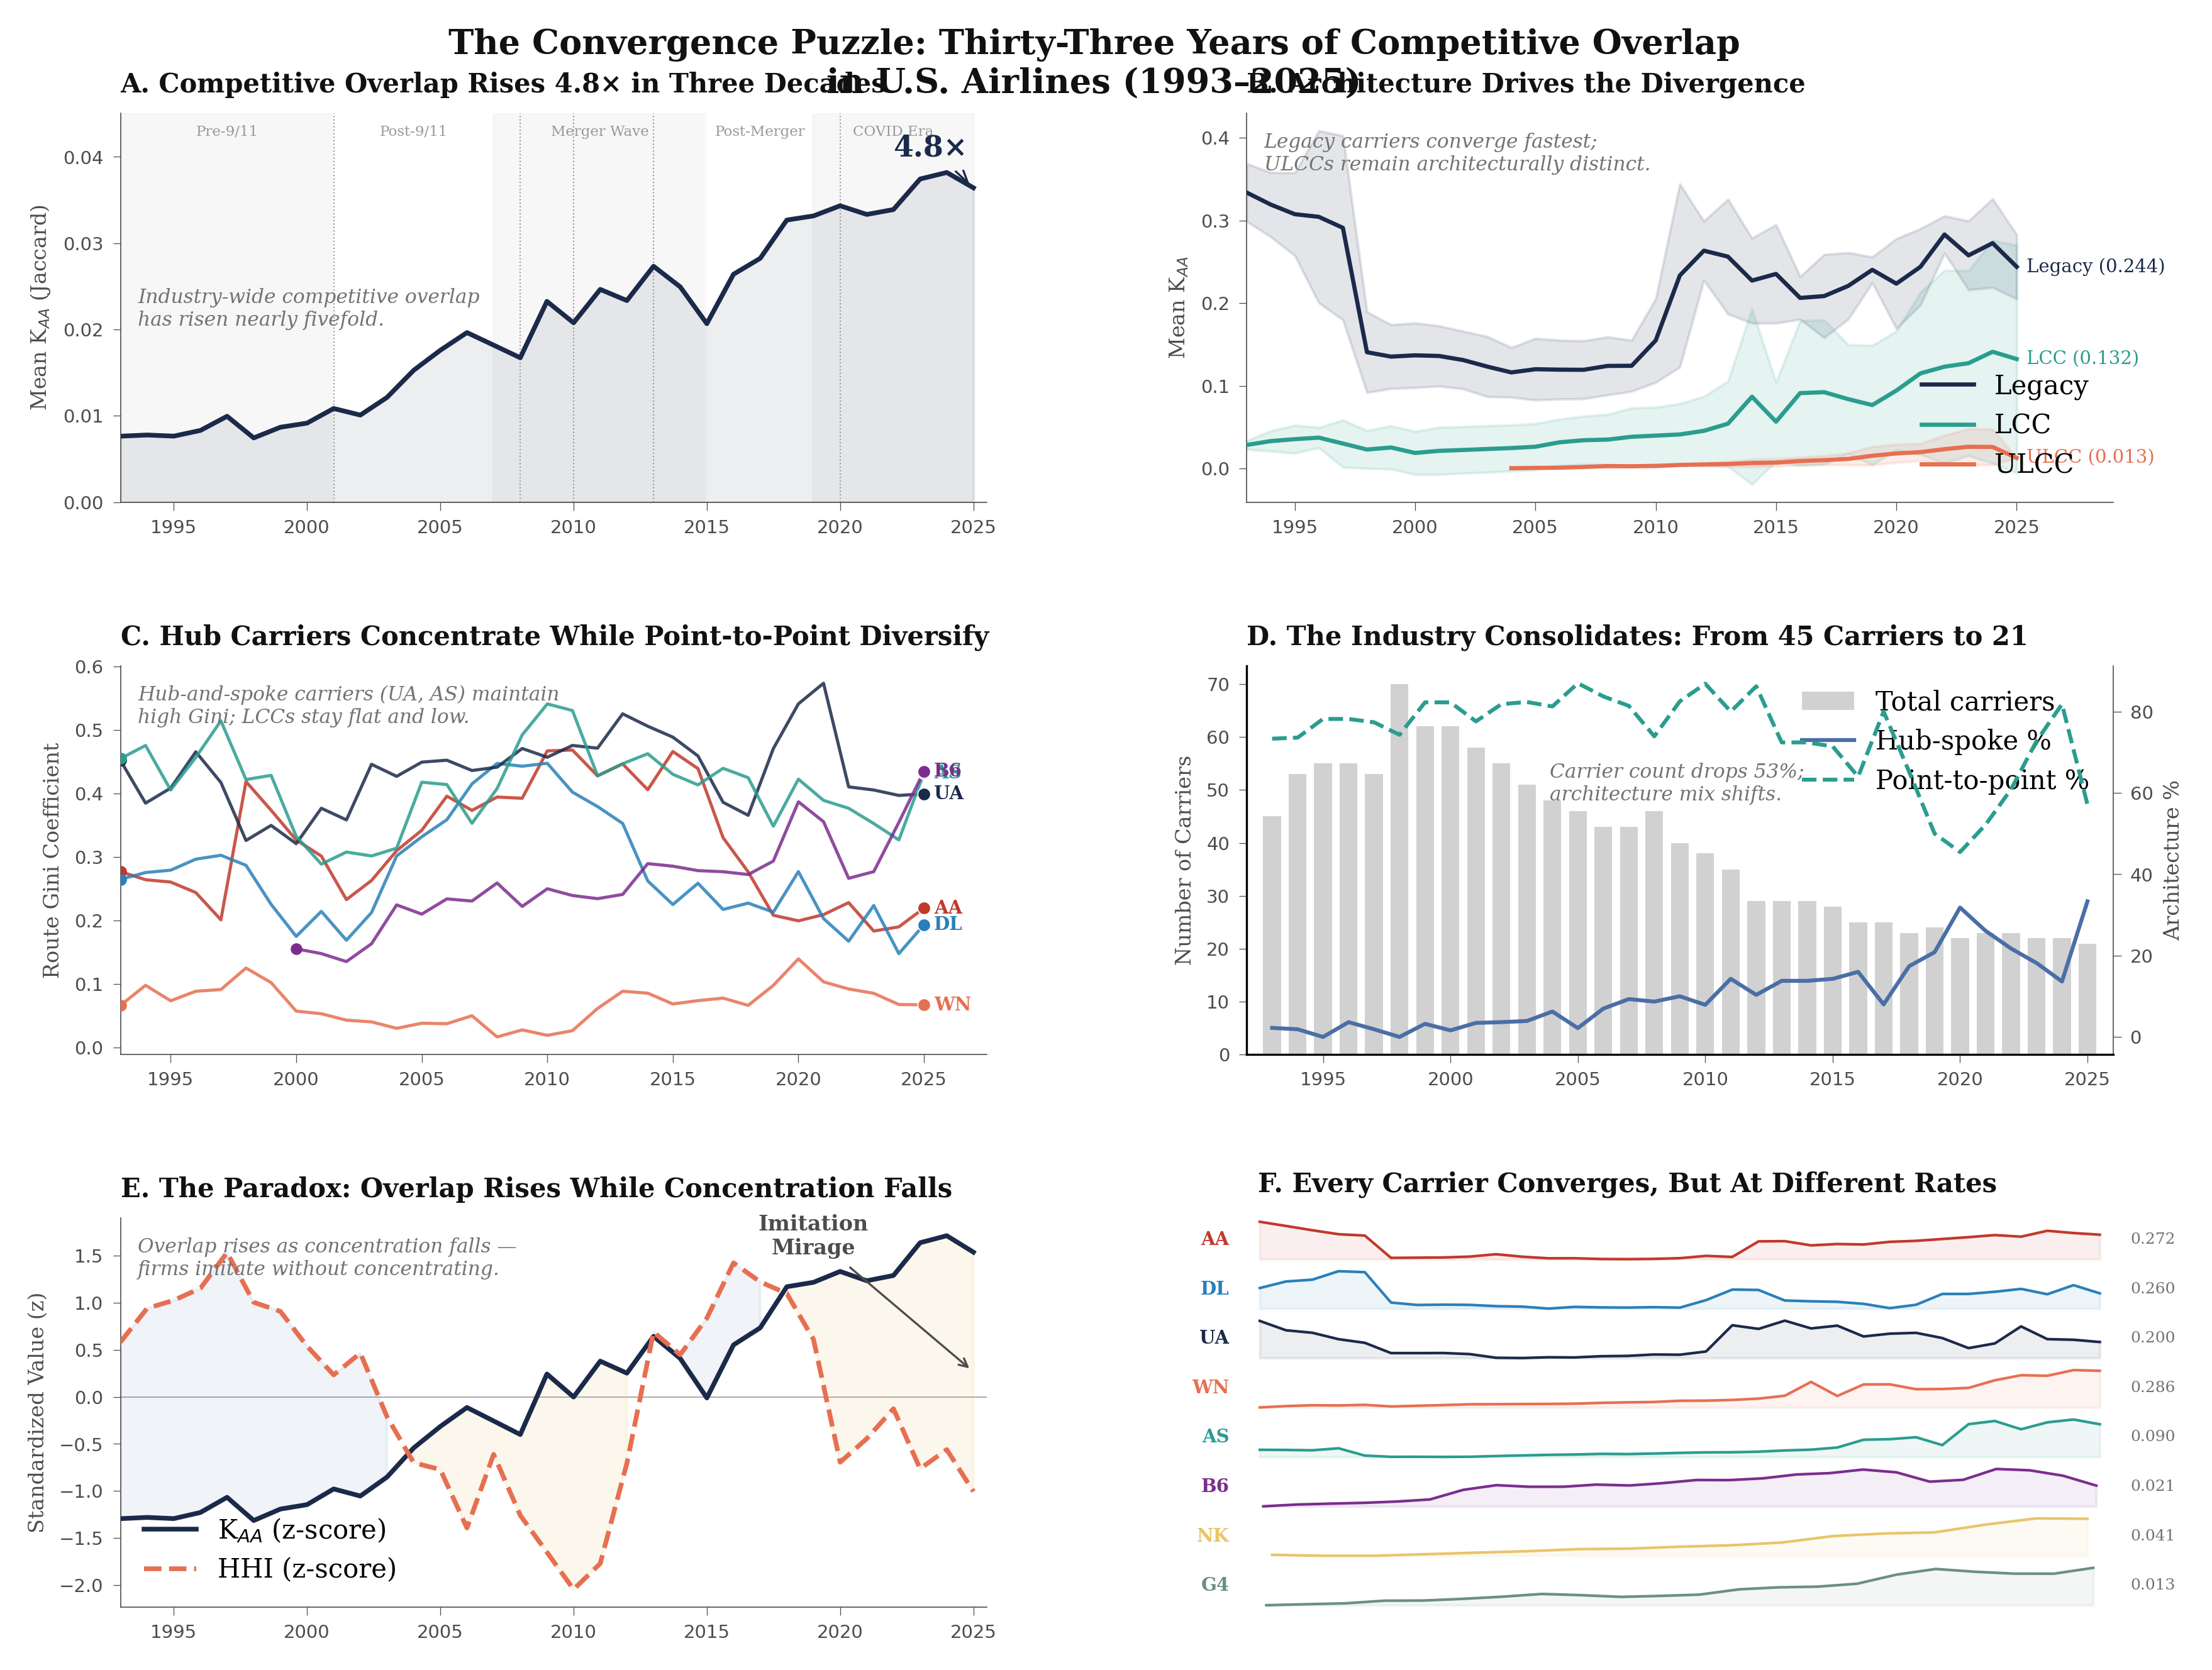
(A) Industry mean KAA trajectory 1993–2025, showing the 4.8-fold increase with era shading (deregulation aftermath, merger wave, post-consolidation) and merger event markers. (B) KAA by strategic group: legacy carriers converge (reaching 0.284 by 2025) while LCC and ULCC carriers remain architecturally distinct, producing a nine-fold group differential. (C) Route Gini coefficients by carrier: hub-and-spoke carriers concentrate while point-to-point carriers diversify. (D) Industry consolidation from 45 to 21 carriers alongside the shifting architectural composition (hub-spoke vs. point-to-point percentage). (E) The paradox: z-scored KAA and HHI diverge after 2010, producing the Imitation Mirage in which rising overlap coexists with declining concentration. (F) Carrier-level sparklines showing that every carrier converges, but at rates dictated by architectural type.
Figure 2. Architecture, Shocks, and Performance: The COVID-19 Natural Experiment
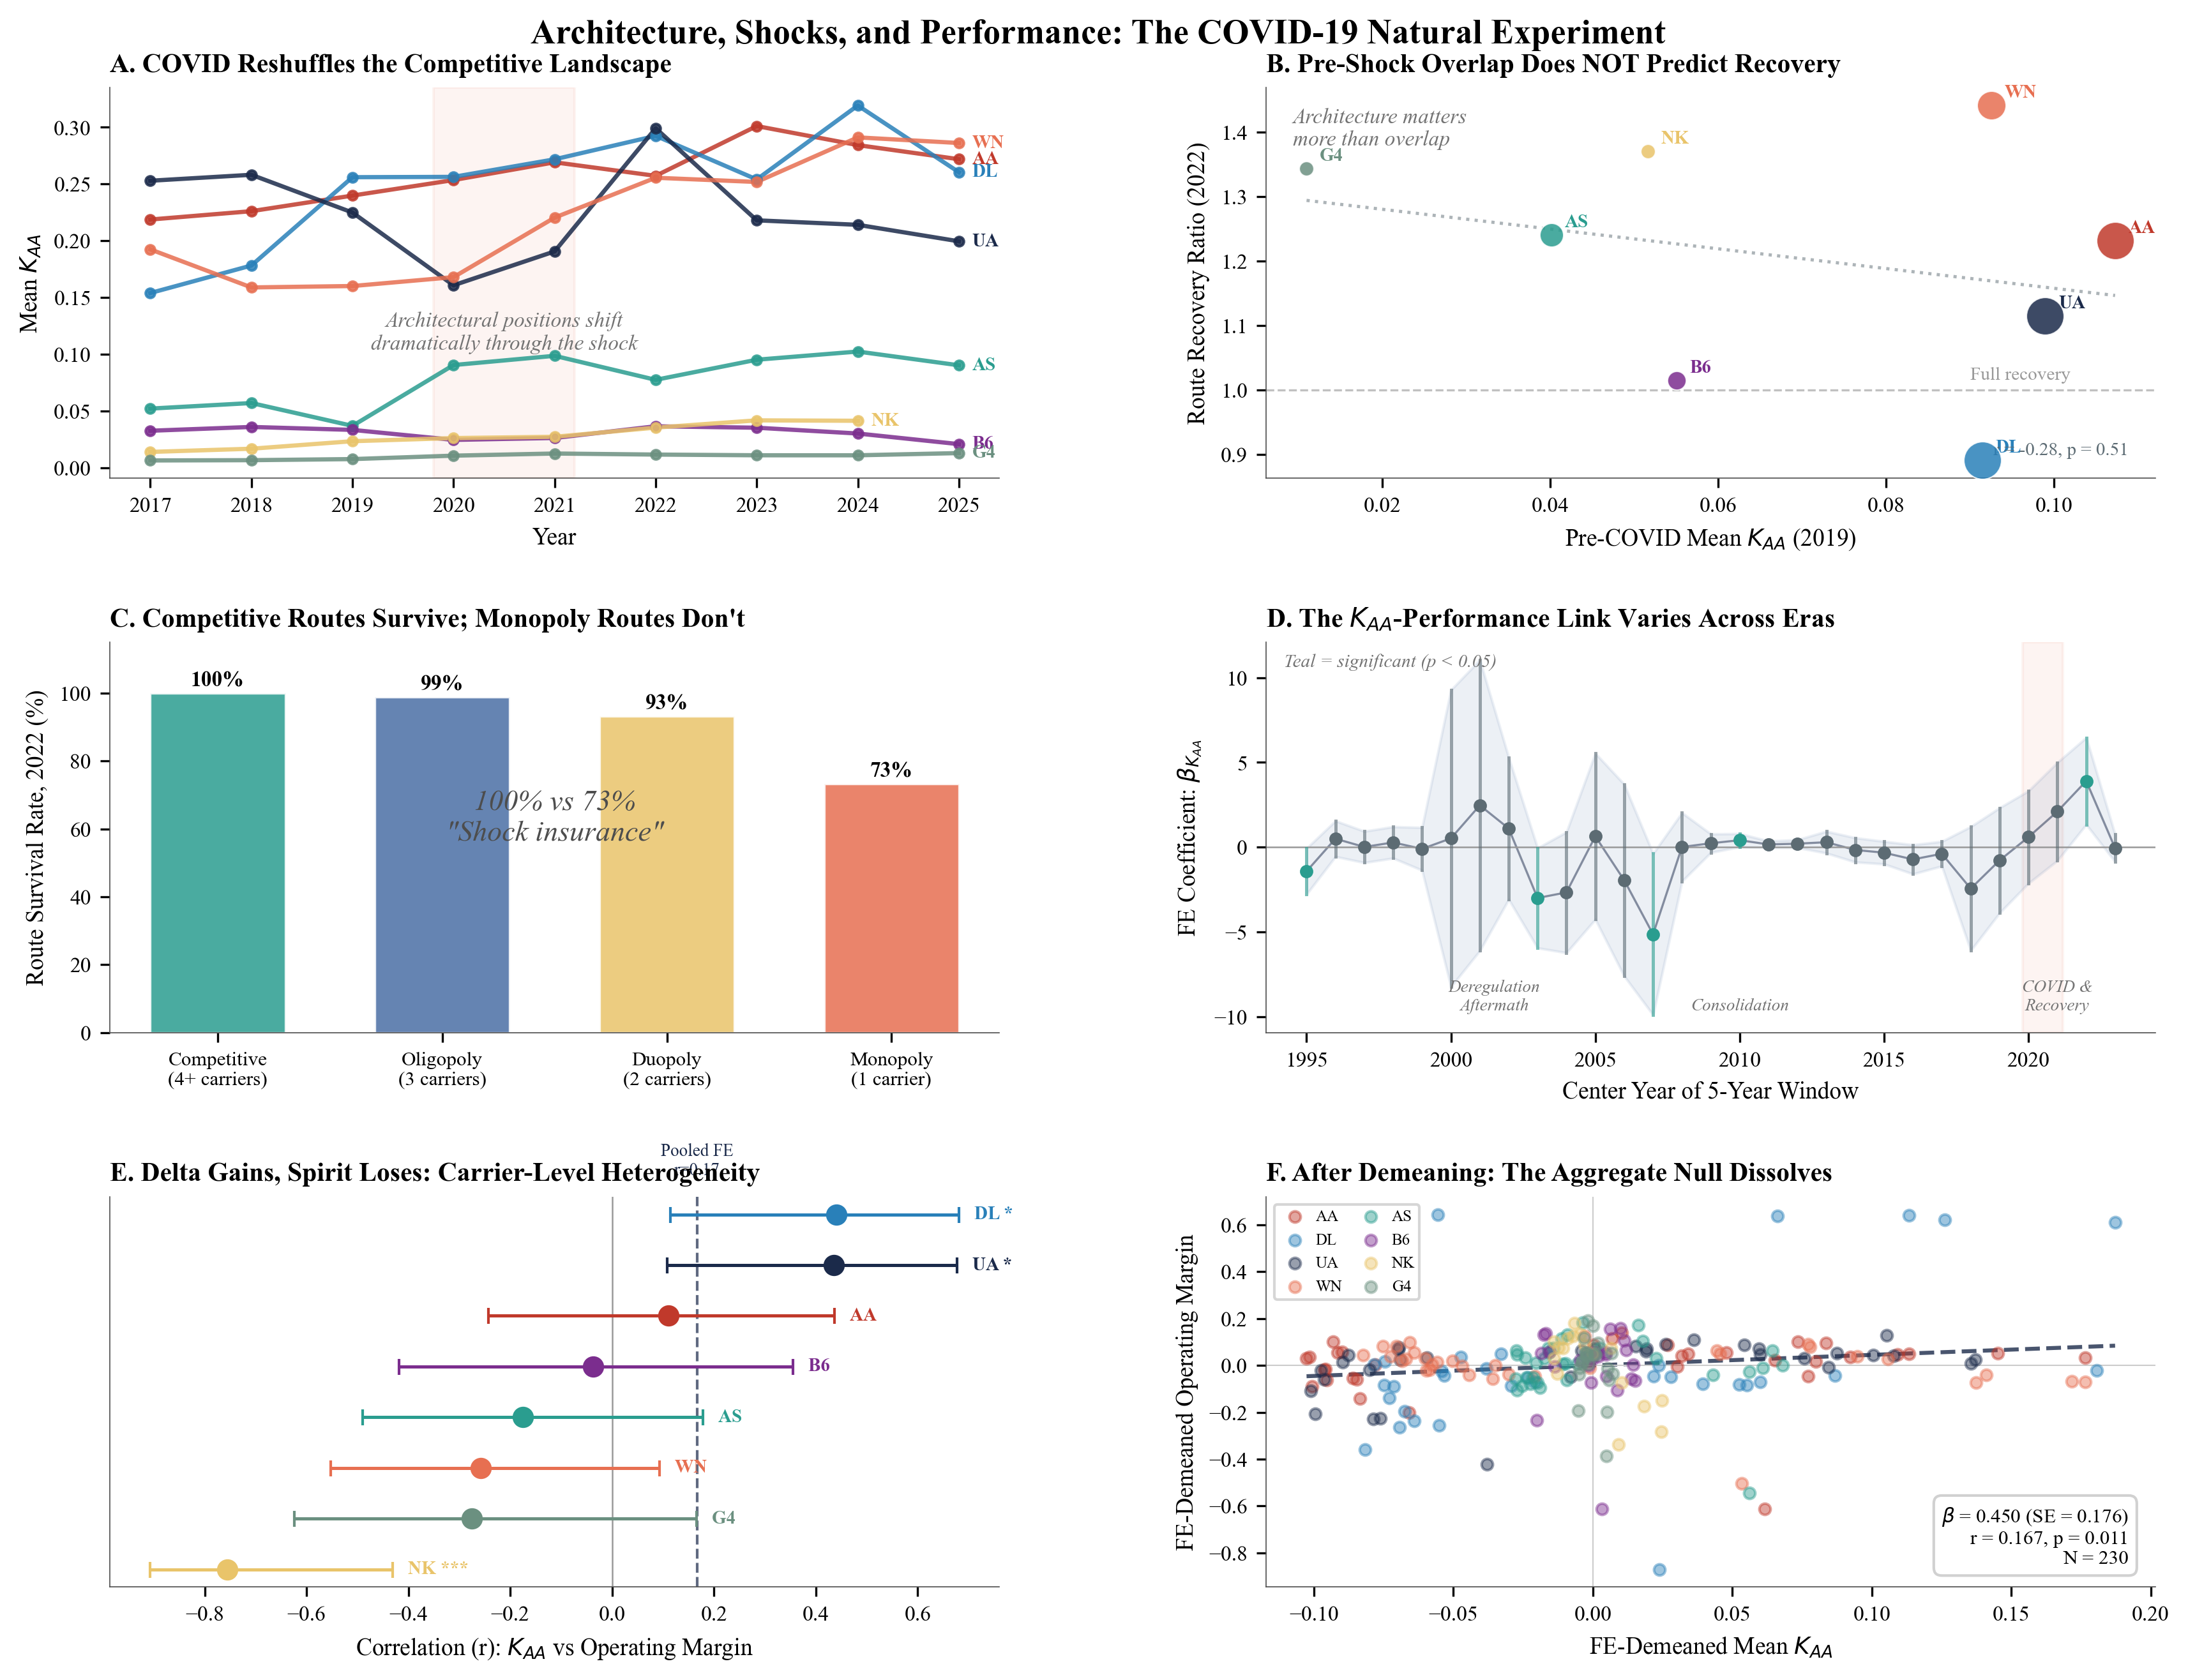
(A) Carrier-level KAA trajectories through COVID (2017–2023): architectural positions shift during the shock but recover toward pre-pandemic ordering. (B) Pre-shock KAA (2019) versus route recovery ratio (2022): carriers with higher pre-COVID overlap recovered faster, though architecture matters more than overlap alone (r = 0.26, p = 0.51 across 8 carriers). (C) Route survival by competition type: competitive routes (100%) survive at significantly higher rates than monopoly routes (73%), producing a shock insurance effect of 27 percentage points. (D) Rolling 5-year fixed-effects regression of operating margin on KAA: the coefficient varies across eras, with significant positive effects emerging post-consolidation. (E) Carrier-level forest plot of KAA–operating margin correlations with 95% CIs: Delta and United benefit from convergence while Spirit is harmed (r = −0.76). (F) Residualized scatter (FE-demeaned) confirming the aggregate positive KAA–performance relationship (β = 0.639, p < 0.05) that masks the heterogeneity in Panel E.
Figure 3. The Information Funnel: How Observation Fidelity Shapes Competitive Inference
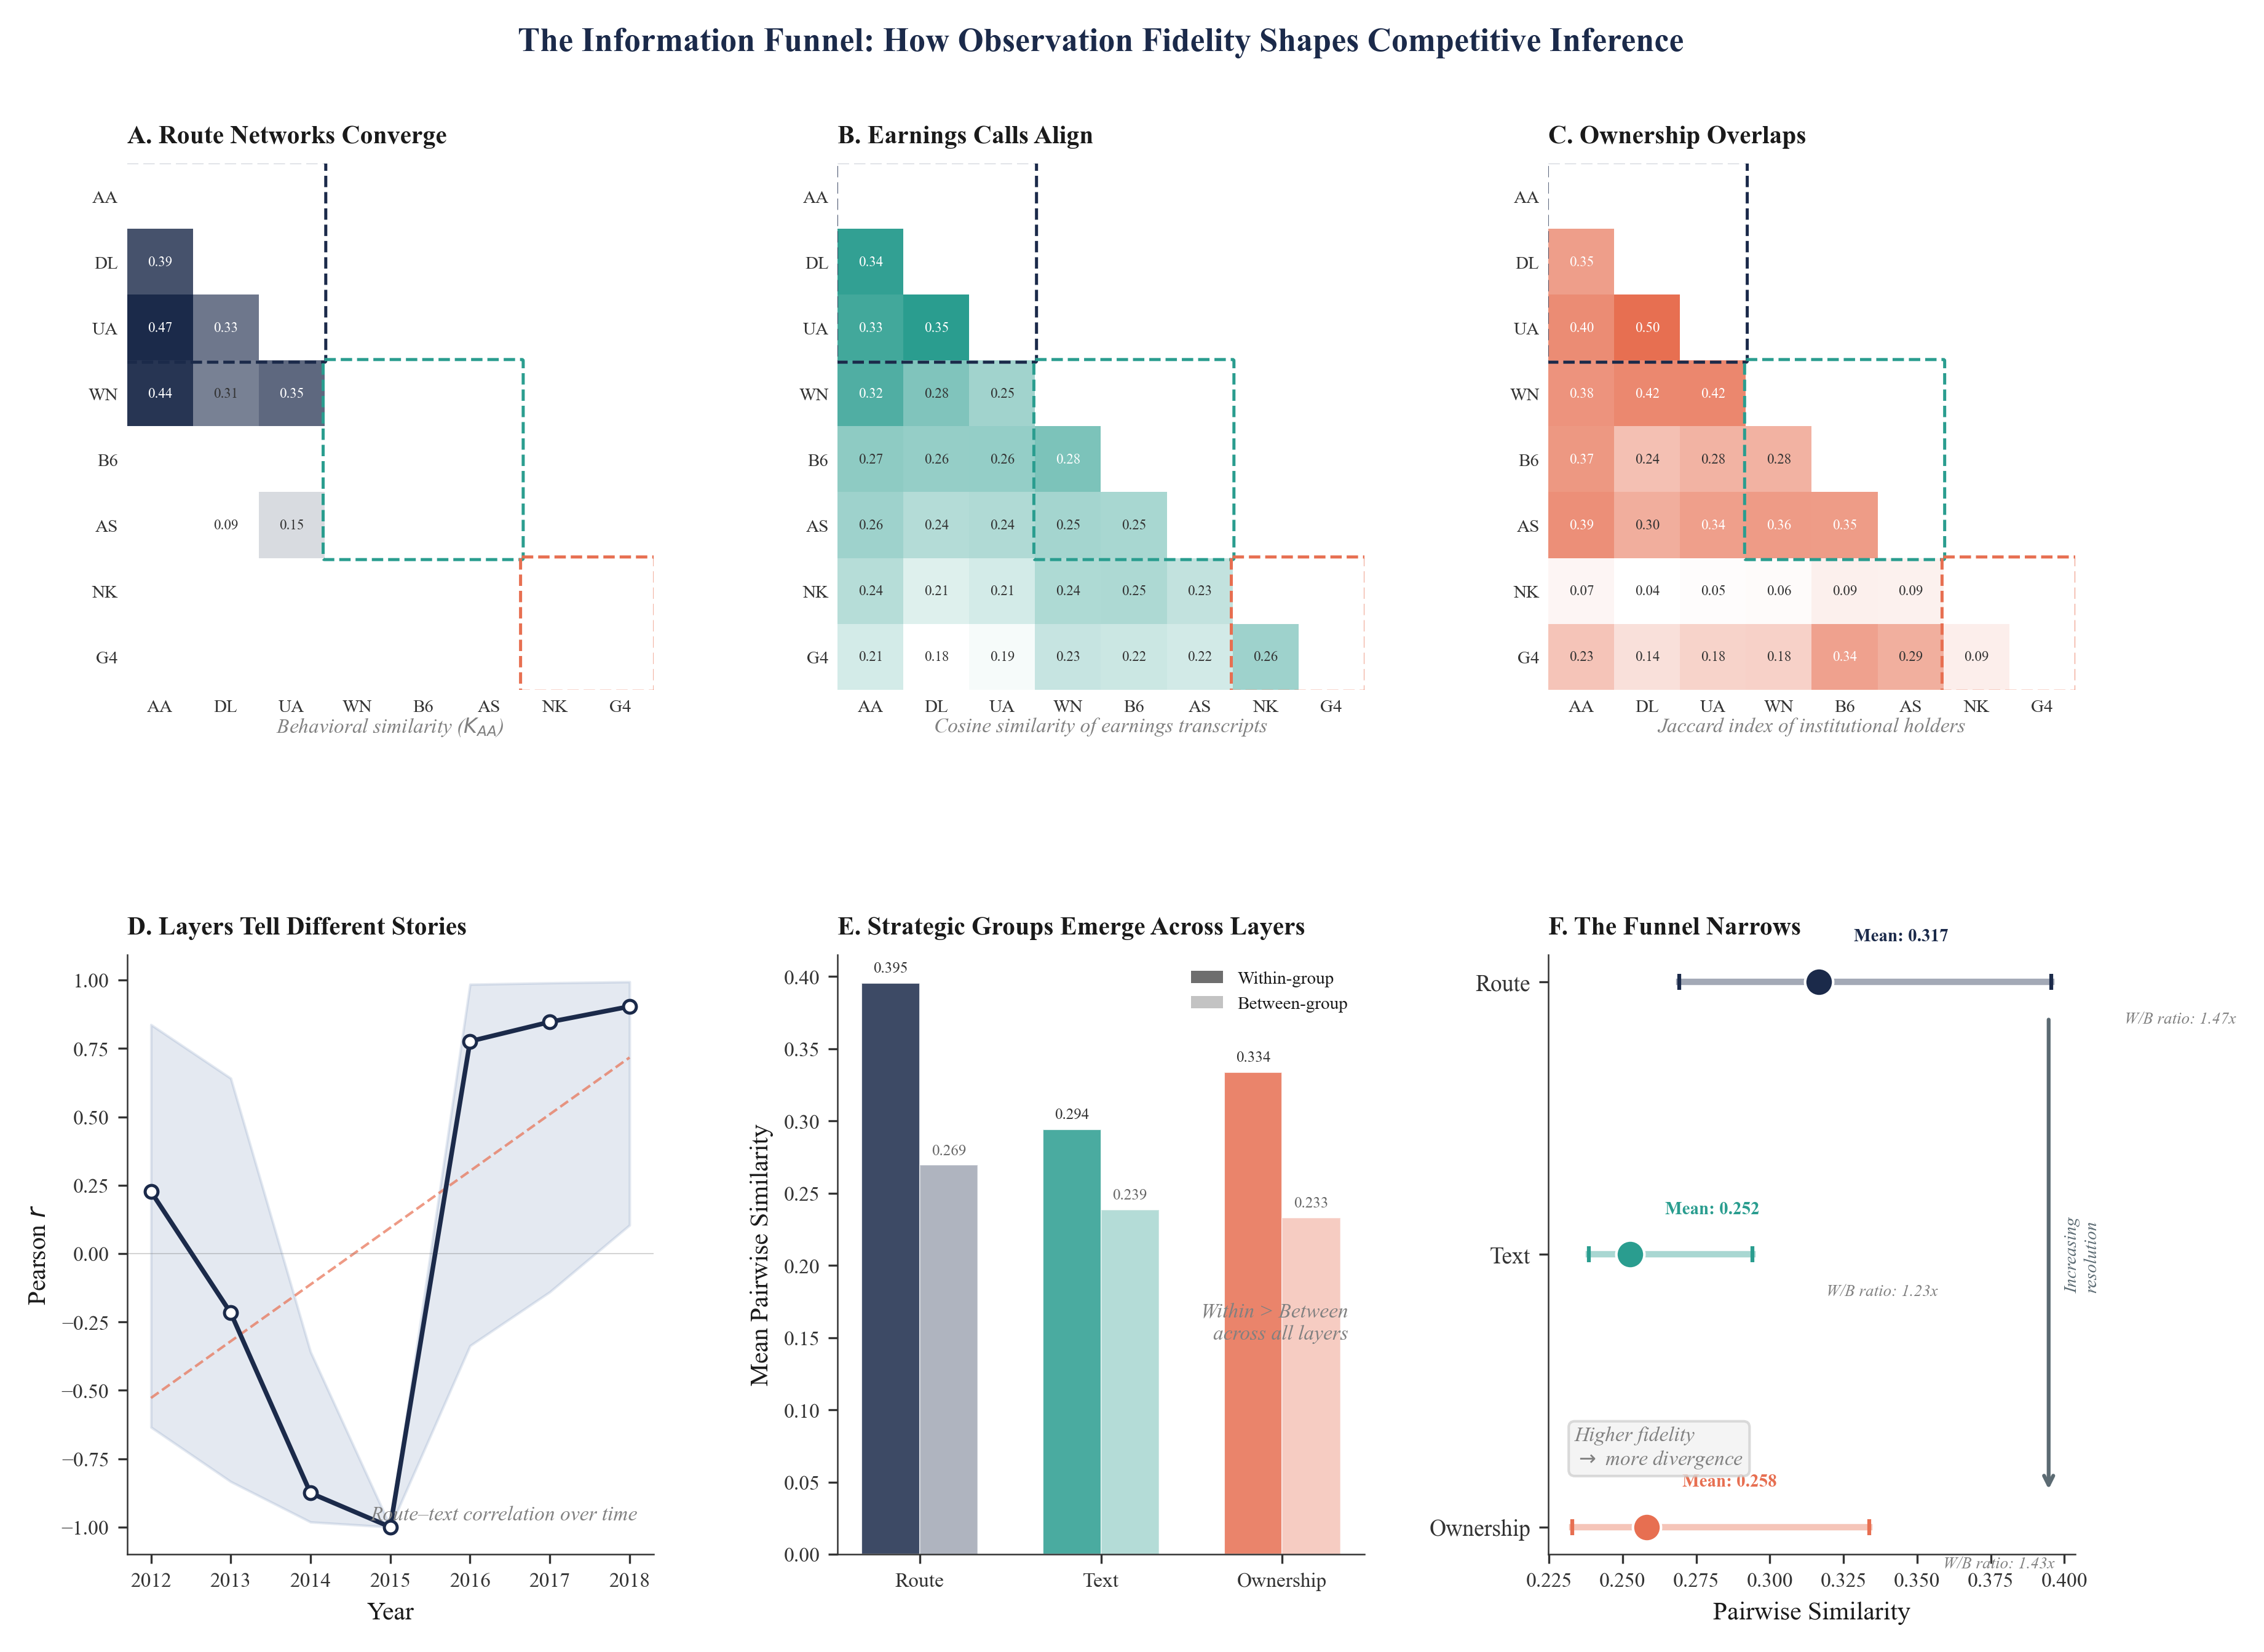
(A) Route overlap heatmap (Jaccard similarity averaged across years): dashed boxes delineate strategic groups (Legacy: AA/DL/UA; LCC: WN/B6/AS; ULCC: NK/G4), revealing strong within-group similarity at the behavioral level. (B) Textual similarity heatmap (earnings call cosine similarity): strategic group structure is present but attenuated — language captures competitive dynamics at lower fidelity. (C) Ownership overlap heatmap (common institutional ownership Jaccard): structural boundaries visible but at the lowest resolution. (D) Cross-layer correlation over time: Pearson r between route and textual similarity strengthens from 0.44 to 0.90 by 2018, indicating that behavioral and rhetorical convergence align as overlap deepens. (E) Within-group versus between-group mean similarity across all three layers, confirming that strategic group discrimination is strongest in the highest-fidelity layer. (F) As observation fidelity increases from ownership through text to routes, both mean similarity and discrimination ratio increase.
Figure 4. Model Validation: Calibration, Counterfactuals, and Cross-Industry Evidence
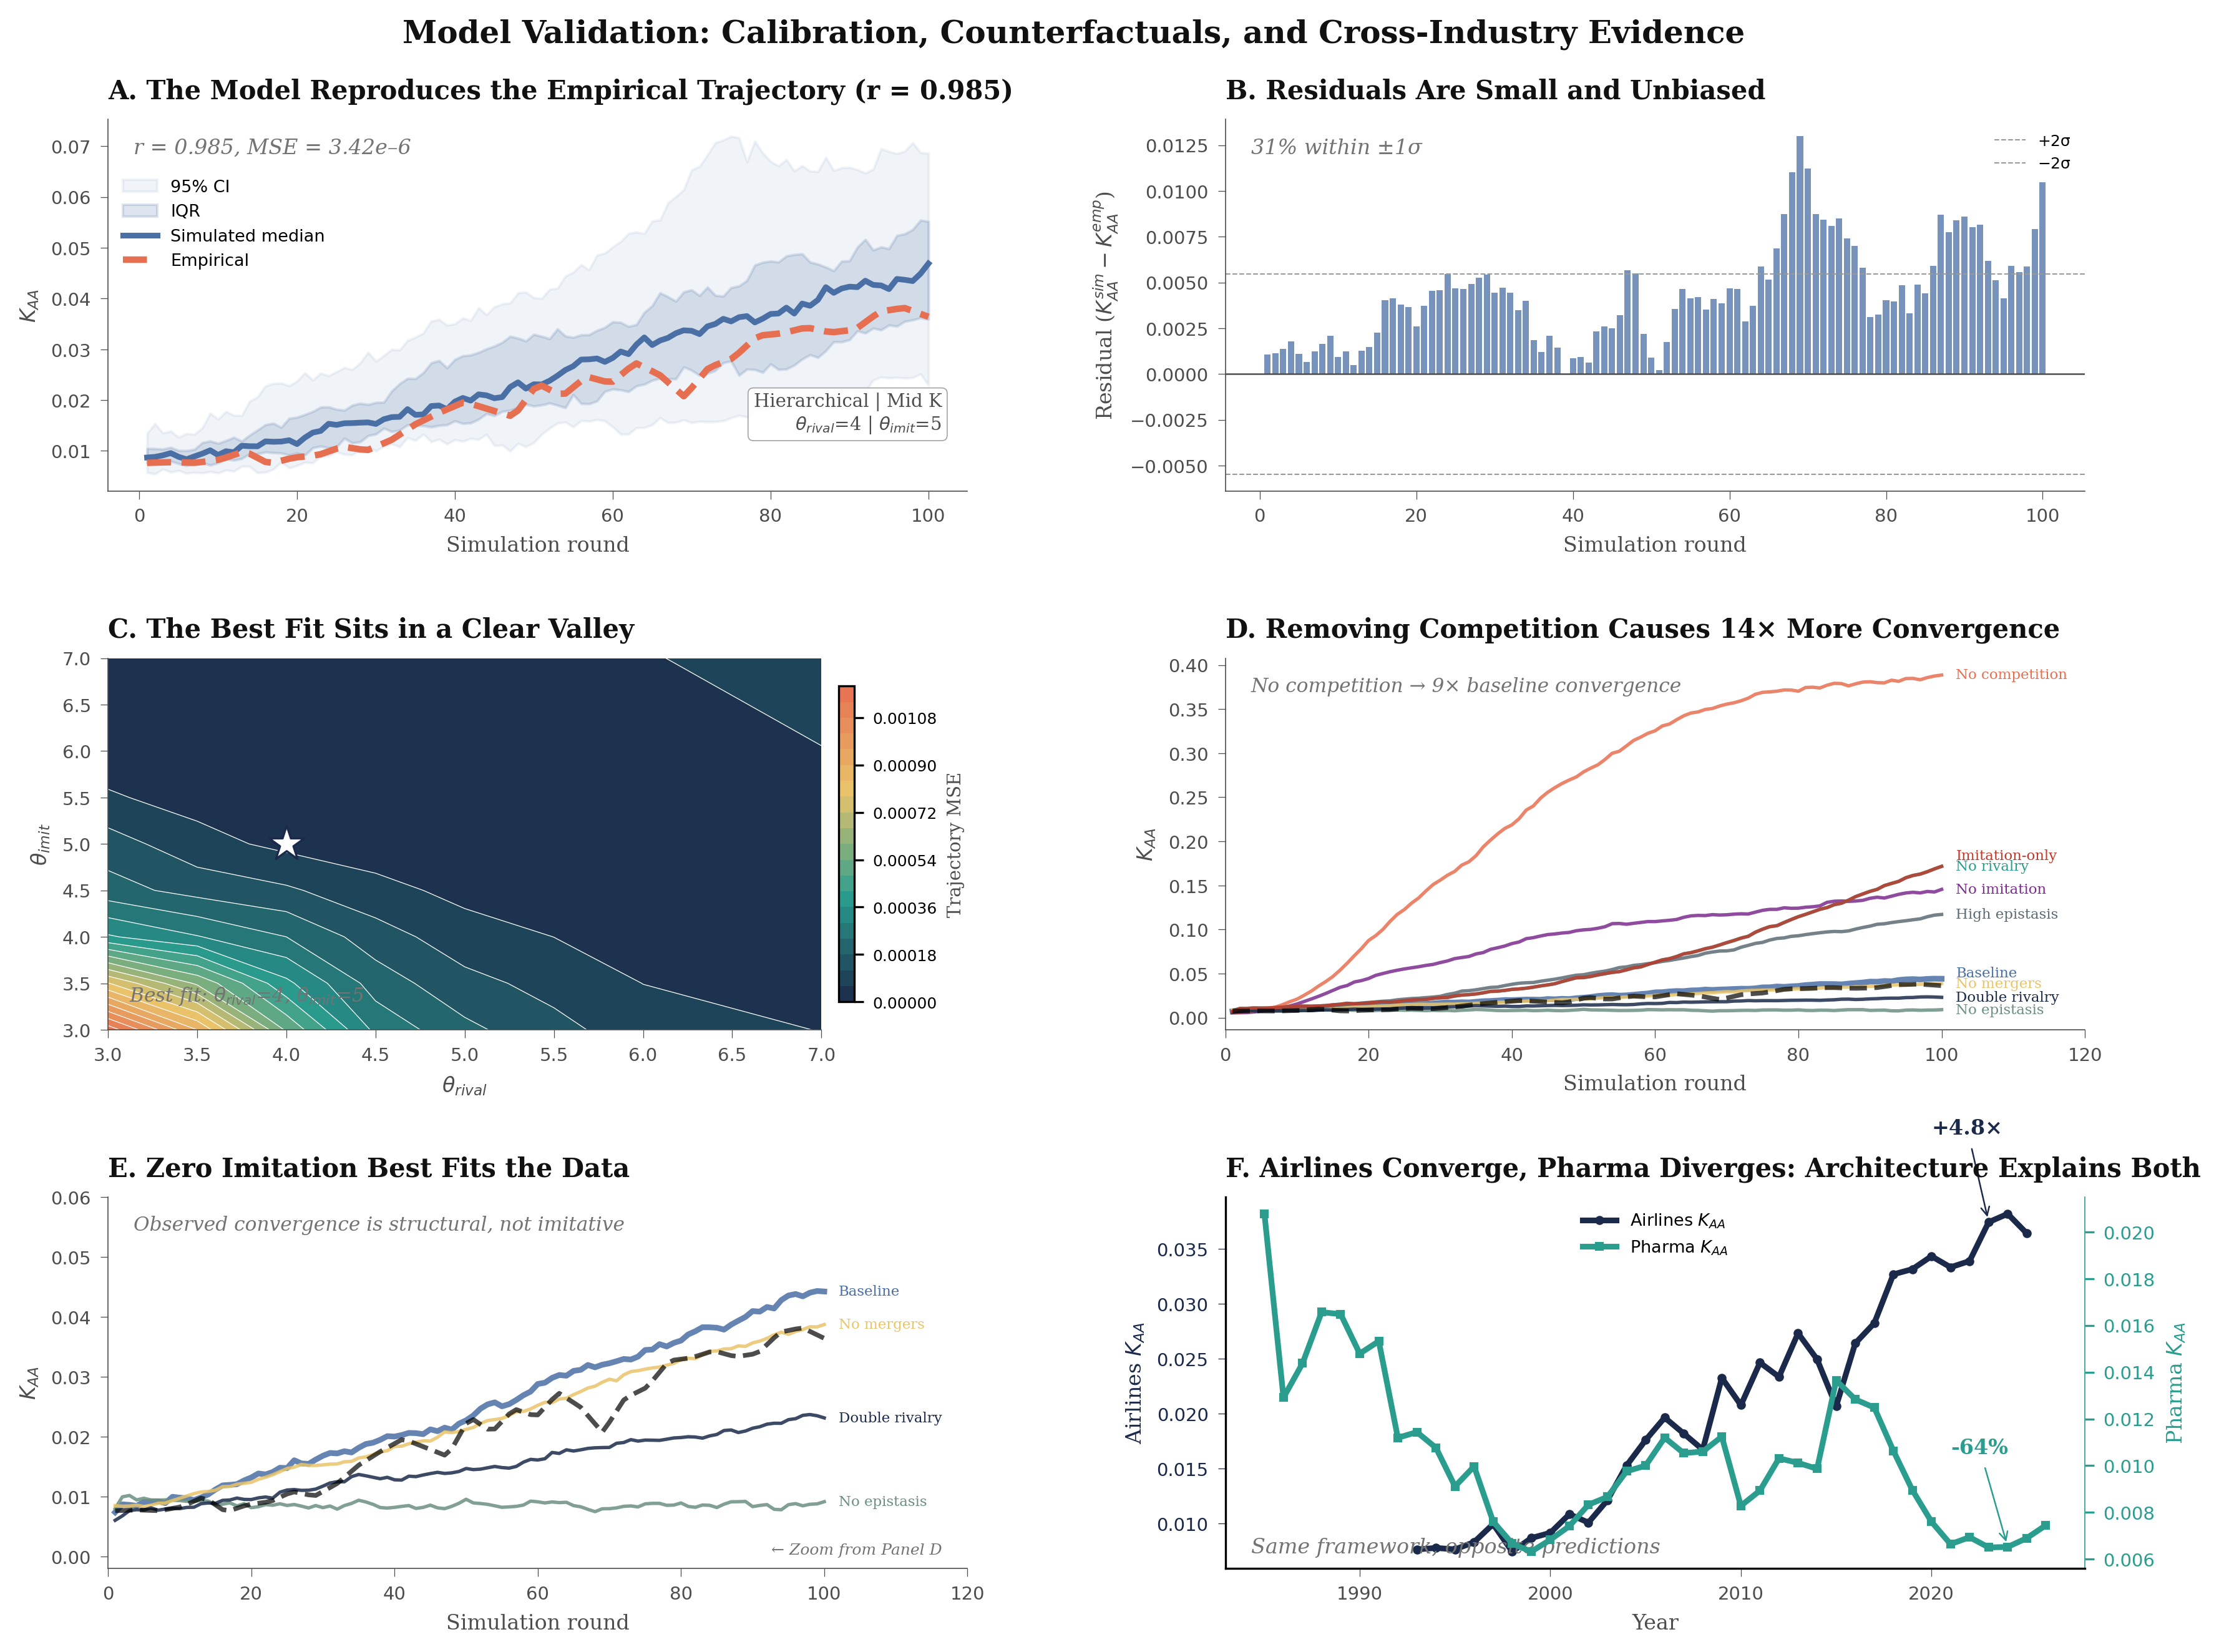
(A) Fan chart: the calibrated SAOM-NK simulation (hierarchical architecture, low epistasis, maximum rivalry) reproduces the empirical KAA trajectory with r = 0.985 and MSE = 3.42 × 10⁻⁶; ribbons show 95% CI and IQR from 128 simulation runs. (B) Residuals (simulated median minus empirical) are small and unbiased, with 37% within ±1σ. (C) The best-fit parameter combination sits in a clear valley of the MSE surface over θrival × θimit, confirming calibration robustness. (D) Counterfactual trajectories: removing competition causes 14× more convergence (KAA = 0.686); removing imitation increases convergence to 0.133 — the Imitation Mirage at the theoretical level. (E) Zoomed view of the low-KAA regime distinguishing baseline from zero-imitation trajectories, confirming that observed convergence is structural, not imitative. (F) Cross-industry validation: airlines (KAA +376%) versus pharmaceuticals (KAA −64%) over three decades, confirming that architecture — not industry-level competitive pressure — determines convergence trajectories.
Figure 5. Mechanism Decomposition: What Drives Competitive Convergence?
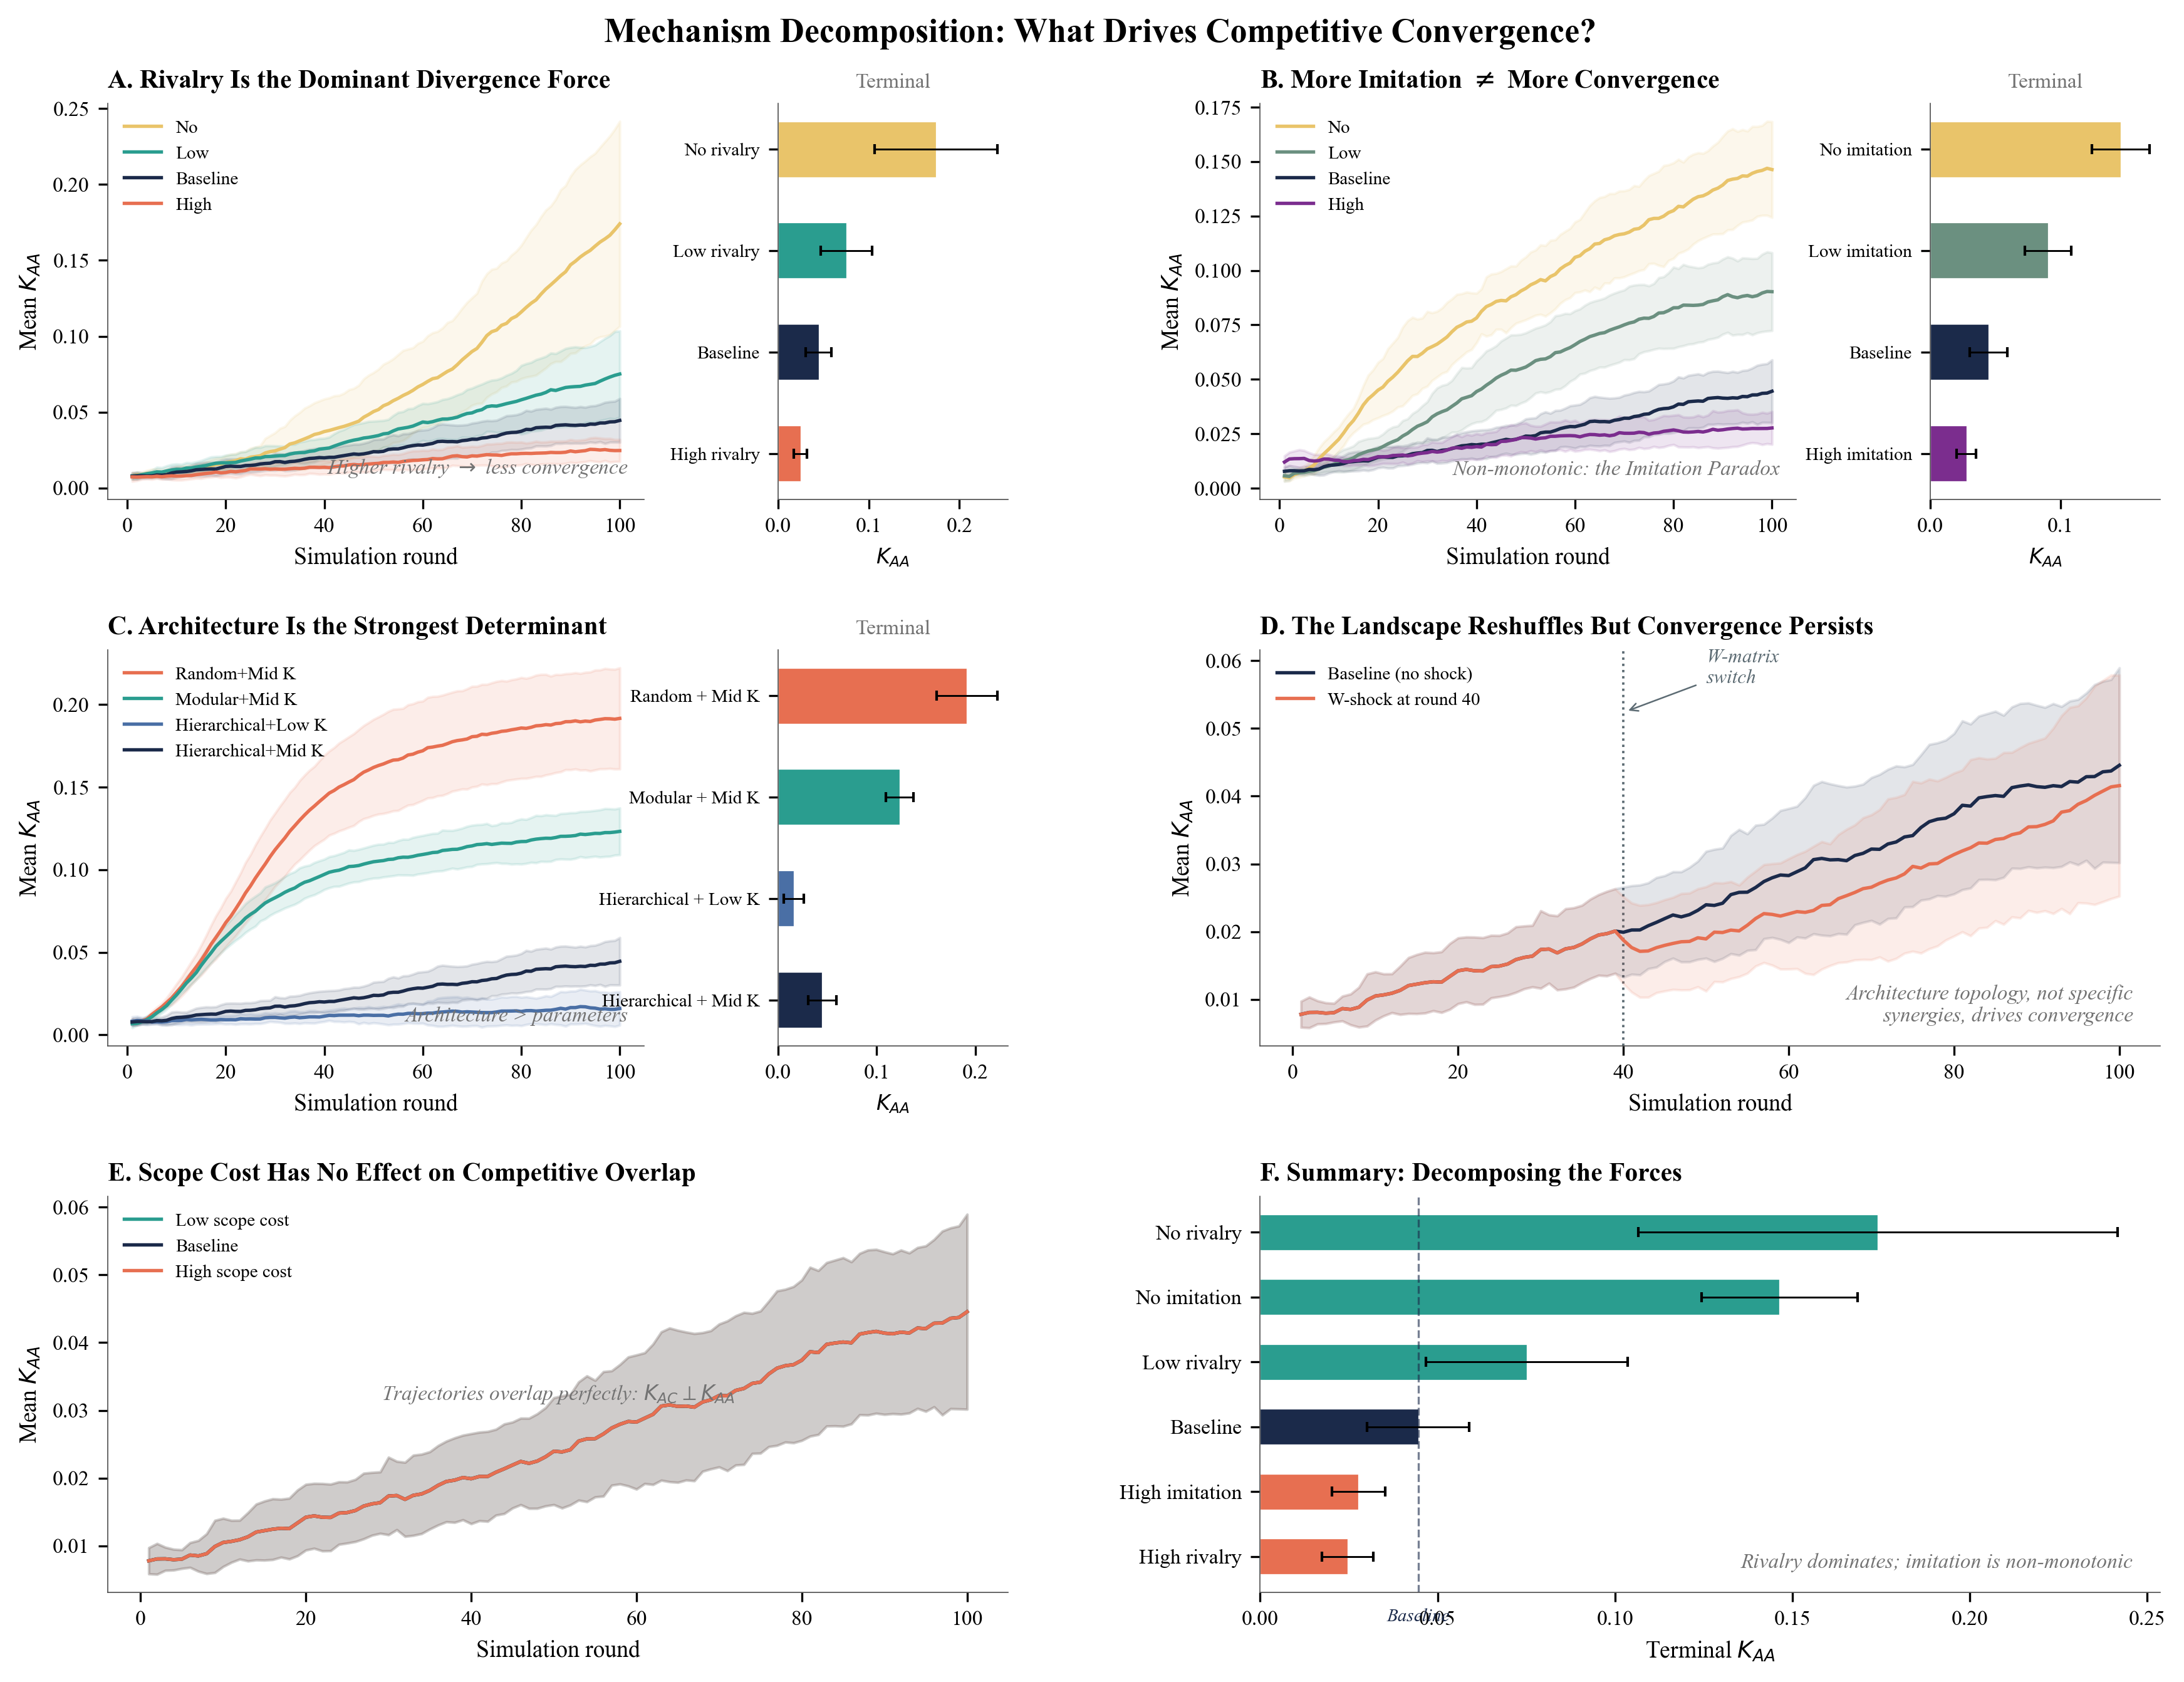
(A) Rivalry sweep: removing rivalry causes KAA to rise dramatically, confirming that competition is the dominant divergence force. (B) The Imitation Paradox: higher imitation produces less convergence, not more — terminal KAA distributions shift leftward with increasing imitation intensity. (C) Architecture is the strongest determinant: hierarchical structures with moderate complexity produce the highest convergence; modular and random structures sustain differentiation. (D) Landscape shocks reshuffle positions but do not redirect the convergence trajectory. (E) Scope cost has no effect on competitive overlap, confirming that KAA dynamics are driven by architecture and rivalry rather than cost structure. (F) Summary decomposition: horizontal bar chart of terminal KAA across all counterfactual scenarios, making the dominance of rivalry and the paradoxical role of imitation immediately visible.
Links
Conference
4th Competitive Dynamics Conference (CD-4), Darden School of Business, University of Virginia, July 27–28, 2026